![]()

![]()
![]()
Explorations of a
Sinusoidal Curve
By: Sydney Roberts
![]()
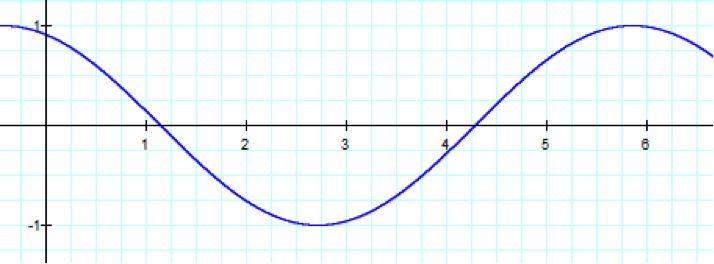
Let’s start of by looking at the graph of y = sin(x).
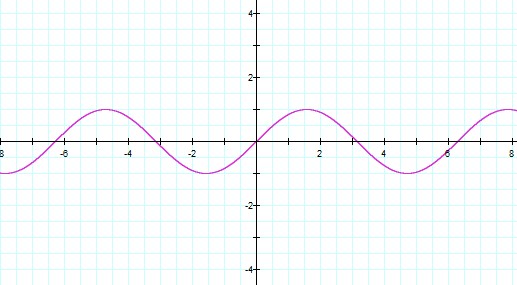
We can see that this function is a sinusoidal curve that
alternates between the y values of -1 and 1 and passes through the point (0,0).
To interpret the parameters of a,b, and c I think it’s best to see what each
parameter does to this base function: y = sin(x) without the other parameters being added
in.
![]()
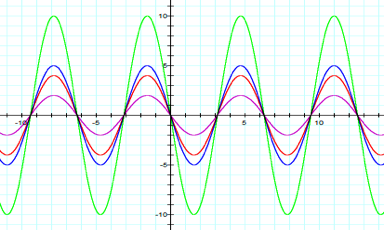
Therefore, let’s explore the graph of y = a sin(x) for different values of a.
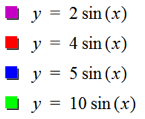
At this point we can hypothesize that the parameter a changes the vertical height of the
sinusoidal curve. In mathematical terms, the parameter a gives us the value of the vertical stretch as compared to the
base function.
For example, if a=5 then our function y = sin(x) is being stretched vertically by a factor
of 5 and will now alternate between -5 and 5.
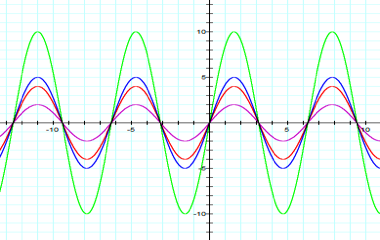
Now what would happen if a is a negative number? Well let’s compare.
The only difference here is that in the second set, the
functions have been reflected across the x-axis. (Why the x-axis? Well, the
negative sign is attached to the entire function, i.e. the negative sign
affects the dependent variable. So if the dependent variable “y” is equal to
one, using a negative sign in front of the function – which is equal to
the dependent variable – now makes y = -1. Hence, y is now reflected
across the x-axis. So the negative sign attached to the entire function will
make the dependent variables reflect across the x-axis). We can see that the
sign of this parameter, a, will
represent whether or not the function has been reflected about the x-axis or
not. Notice that the sign does not affect
the height of the function. The height of a sine function is typically
referred to as the “amplitude.” So we can say that |a| will give us the amplitude of the function
![]()
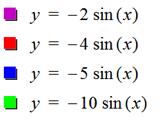
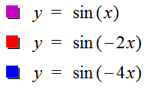
Now let’s move on the parameter, b. Let’s examine the graph of the function y = sin(bx) for different values of b.

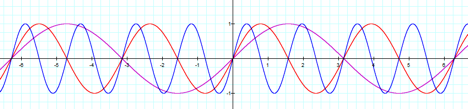
At first these graphs look muddled and hard to interpret.
However, let’s first focus on the purple graph of the function y = sin(x). Notice that the period of this function
is 2π. That is, the graph repeats every 2π. Now look at the red graph of the
function y = sin(2x). This function repeats twice within 2π,
so we know that the period is one half of 2π (or π). The final blue graph of
the function y = sin(4x) repeats 4 times within 2π, so the period
should be one fourth of 2π (or π/2 ). Can you notice the relationship
between b and the period, yet? Maybe not. Let’s
consider more graphs.
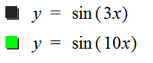
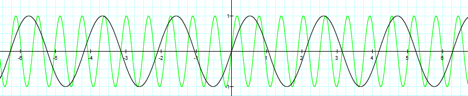
Note that y = sin(3x) repeats 3 times within 2π and y = sin(10x) repeats 10 times within 2π. Now the
relationship should be clear. Before drawing any conclusions though, we should
investigate what happens if b is
negative.
Again, we see that the negative sign only causes a reflection
(this time about the y-axis) of the function. Why about the y-axis? Well this
negative sign in explicitly attached to the “x” or the independent variable.
Then every value
of x that was positive, is now negative. So 2 is
reflected about the y-axis to -2, 4 is reflected to -4, etc. So each x value is
now reflected across the y-axis.
So now let’s state that the relationship between b and 2π seems to determine the period
of our sine function. More specifically, we can see that the period, p, can be found by
![]()
In the case of the sine function, the period can also be
referred to as the horizontal stretch/compression along the x-axis where an
increase in |b| will cause the function to compress more and more compared to
the base function.
![]()
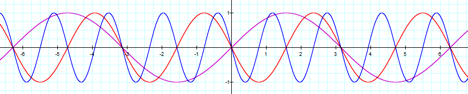
Now we can move onto the parameter c. Again, let’s explore through the graphs of different functions.
This time, however, I think it would be best to graph one function at a time.
![]()
![]()
![]()
What is happening
now as c becomes more and more positive? It
appears that the graph is “shifting” to the left. In mathematical terms, we call this a
translation. Why though, does an increase cause the graph to “decrease” down
the x-axis? (i.e. Why does x+1 cause the graph to move -1 units to the left?)
Well this takes a
bit more exploring. The easiest
intuitive reason I can give for this involves Daylight Saving Time. In the
spring, we set our clocks forward one hour. So essentially we are changing from
time “x” to time “x+1”. But what does this mean for the hours in the day that
the clocks change? Well now we have one LESS hour during that day.
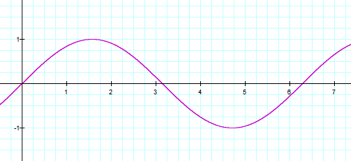
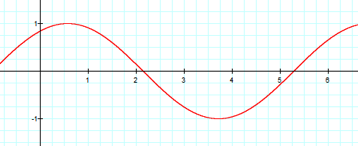
Well if this is
true, does it not make sense that if c were to become more and more
negative, then the graph would make a horizontal translation in the positive
direction? Well let’s see.
![]()
![]()


Now it appears that our theories were correct. A one unit decrease in c causes a horizontal translation in the negative direction. Hence, we know that c gives the horizontal translation in the function .
Putting
all of this together, what do you think the graph of y = 2sin(5x+3) would look like? Well
using what we learned, we know that this sinusodial curve will have an
amplitude of 2, a period of 2π/5, and has a horizontal
translation of 3 in the positive direction. Does the following graph match this
description?
/graph.png)
Hopefully, your answer is yes.
![]()
Now that we have covered all the different parameters a, b, and c we should ask ourselves, “Does it matter that we only considered
that a, b, and c were only represented as integers?” Well, no. The absolute value
of a will always represent the
amplitude of the function, the period will always be 2π/|b| , and c
will always represent the horizontal translation of the function. These facts
do not depend on what classification the parameters are. Whether they are
integers, rational numbers, irrational numbers, etc., it doesn’t matter.
Also, for further exploration, examine how the parameter d would affect the sine function when y = a sin(bx+c) + d.
![]()
![]()
![]()